Being a boutique agency, we really like free tools that make our lives as performance marketers easier.
And we really love a Google spreadsheet.
Here at Growth Minded Marketing, we’re lucky to use a suite of keyword analysis tools to help us with our research and inform our Google Ads and SEO strategies – but we wanted to make something totally free (and relatively simple) for businesses and advertisers to use to better highlight the keyword landscape and potential opportunity for their services or products – all taken from their own data.
We’ve created a powerful free tool that businesses and PPC advertisers can use to get a better understanding of their keyword performance across organic search and Google Ads – with data taken directly from Google Search Console, Google Analytics and Google Ads.
Using Google Search Console (GSC) data, we’re able to see what keywords our sites rank for organically in Google. Combining that with Google Ads queries, revenue and goal data from Google Analytics data we can gain a deeper insight into how our keywords perform across organic search and Google Ads.
Purpose of the sheet
The idea of the sheet is to highlight the overall market share for specific target keywords you choose that are related to your business or client.
Opportunities and gaps are highlighted where Google Ads can fill in the missing market share based on your Search Console data.
If there’s a crossover of keywords you target through organic and paid search, you’ll be able to see the ratio between the 2 to see where the dependency lays for your keywords.
With your target keywords, you can export keyword volumes, CPCs, and trends directly from the Google Ads Keyword Planner to highlight and forecast the opportunities for those terms.
Requirements
There are a few steps needed to get all the required data into the document – depending on your caffeination levels, we reckon you’ll be able to get all your data gathered in about 15 minutes.
You’ll need access to:
- Google Sheets
- Google Search Console
- Google Ads
- Google Analytics
- A free version of Supermetrics for Google Sheets
- A list of target keywords you’d like to see data on
Extra recommendations:
- Some great coffee
- Easy-listening music while you’re building the coolest sheet you’ve ever used.
Caveats
Where we’re highlighted with ‘Note:‘ – it’s important to follow exactly what we’ve outlined so that everything is exported and pasted correctly 🙂
While we’ve made this sheet as easy as possible to use and update, it helps if you know your way around a bit of formula. If you’re missing data or seeing errors for your target keywords, check the formula in hidden columns to make sure your cells are correctly connected.
Getting started
Step 1 – Make a copy of the Organic vs Paid Keyword Analysis Tool
Here’s a link to the Google Spreadsheet. You’ll need to make a copy of it to edit and use your own data.
Log in to your Google account & open the sheet. Then click File > Make a copy
Step 2 – Getting your Search Console data
Login to Google Search Console (GSC)
With your selected domain property, click into Performance and select your date range.
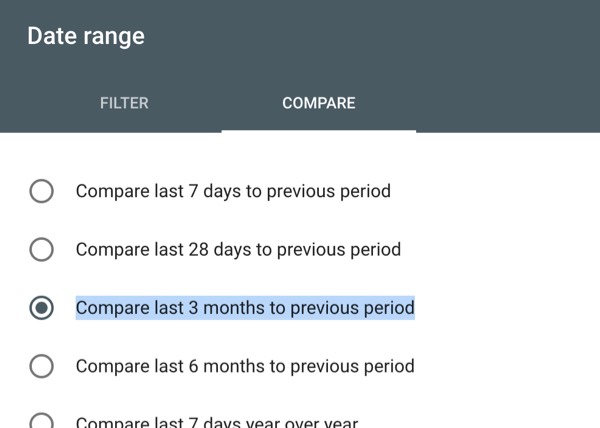
Make sure you click into ‘Compare’, then select your dates. We’ve used ‘Compare last 3 months to previous period’
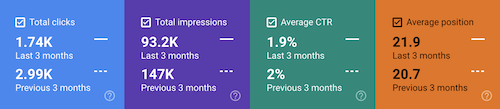
Make sure Total clicks, Total impressions, Average CTR and Average position are ticked, then hit Export in the top right, and save as Google Sheets.
Step 3 – Importing your data to the Organic vs Paid Keyword Analysis Tool
In your newly exported sheet, copy all the data in the Queries tab. Now, over in our spreadsheet, delete all the old data in the ‘1. PASTE DATA > GSC Queries’ tab, and paste as values into cell A2.
Back in the exported GSC sheet, head to the Pages tab, and copy all the data. Now back in our spreadsheet, delete the old data in the ‘2. PASTE DATA > GSC Pages’ tab, and paste as values into cell A2.
You’ll see that the ‘All GSC Data’ tab now has been populated with your data.
Boom! You’re a copy/pasting spreadsheeting legend.
Step 4 – Defining brand terms
In the ‘Brand terms’ tab, it’s time to define your branded terms and your site URL. Branded terms are your brand name and variants, and specific product names or services if you have them.
Add your homepage site URL in the correct cell, without the trailing slash (/) at the end. Leaving the / will break everything in life you’ve ever held dear.
Step 5 – Getting Supermetrics
Supermetrics is a very cool reporting automation tool for PPC, SEO, and web analytics that hooks into a ton of different data sources.
As we’re only pulling data from Google Analytics, you can sign up with a free ‘hobby’ account which is totally free. No credit card needed guys!
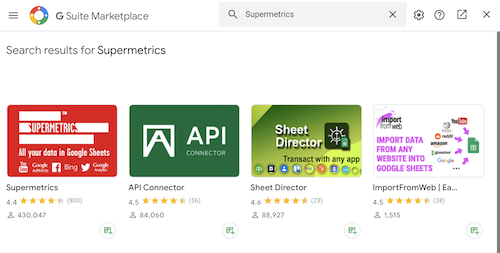
First, you need to install the Supermetrics Add-on for Google Sheets.
Open Google Sheets, click Add-ons in the toolbar at the top > Get Add-ons. Then search for Supermetrics, then click and install.
Follow all the usual set up stuff, allowing all the permissions etc – and you’re good to go!
Now you’re ready to pull in some data from Google Analytics.
Step 6 – Setting up Supermetrics
This is probably the trickiest step. What we’re doing is telling Supermetrics which metrics we’d like to see from Google Analytics, in what order, over whatever date range we want 🙂
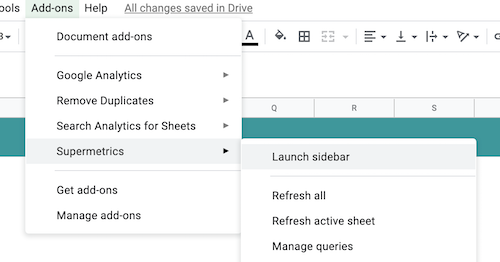
Now head to the Supermetrics – Google Analytics tab our sheet. Click into Add-ons > Supermetrics > Launch Sidebar
In Data source, select Google Analytics


In Select views, select your chosen Google Analytics property.

In Select dates, choose your target date range. Try and tie this in with your GSC export time range for correlated data.

In Select metrics, add Sessions, Transactions, Transaction Revenue, and Goal completions, all goals.
Note: Keep to that exact order.
In Split by, where it says Split to rows, add Landing page path.

Note: For the formula in the sheet to work, it’s essential that your data is pulled to the highlighted cell – B7.
Click the blue ‘Get Data into Table’ button!
Once your data is pulled through, make sure the concatenate formula in column A is dragged down to include all your Landing page path data in column B.
Step 7 – Google Ads query data
Next up, log in to Google Ads.
In your chosen account, click into Reports in the top right corner.
Hit that big + Custom report button, and create a Table report.
Here we’ll add the metrics we need to export back into our growing sheet!
Add these metrics:
Search terms, Impressions, Clicks, CTR, Cost, Impr. (Top) %, Conversions, Conversion rate, Cost / Conv, Conv. Value, All conv. Value / cost
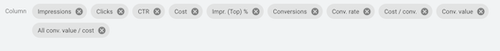
Note: Keep to this exact order. (Drag them into the correct places)
Select your date range (try and keep in line with GSC and Supermetics exports), save and download.
Open your download Google Ads data, and copy all. Then head over to the ‘Google Ads – Queries’ report data tab, and paste as values into cell A2 (making sure to delete old placeholder data)
Step 8 – Google Ads Keyword Planner data
Head over to the Google Ads Keyword Planner
From within Google Ads > Tools & Settings. Then under ‘Planning’, select ‘Keyword Planner’

Select ‘Get search volume and forecasts’, and then paste in your target keywords.

Click into ‘Historical Metrics’, make sure your target location and language is set correctly.

Click the download arrow on the top right, and make sure to download ‘Plan historical metrics (.csv)’
Now head back to our spreadsheet, and copy/paste your downloaded historical metrics data into the Keyword Planner Data tab (cell A2), making sure to delete the old placeholder data.
Pow! Now you’ve got all your data – time to start analyzing!
A breakdown of the analysis pages
Using our placeholder data already in the sheet, you can see examples of the data output.
All GSC Data
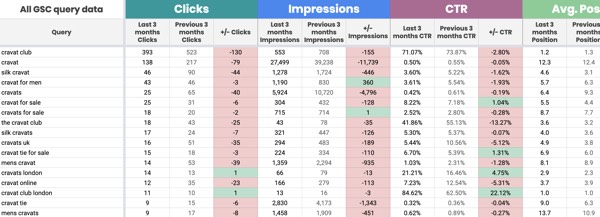
What:‘All GSC Data‘ pulls in all your keyword data from Google Search Console for your required date range – split by Clicks, Impressions, CTR and Avg Position
Why: These are terms your chosen site actually ranks for. As a PPC manager, you can mine this data for more opportunities & keywords to target.
If you’re seeing a ton of red in your +/- columns, this could indicate a ton of things: seasonality, organic performance decline, lack of keyword strategy.
Landing Page value
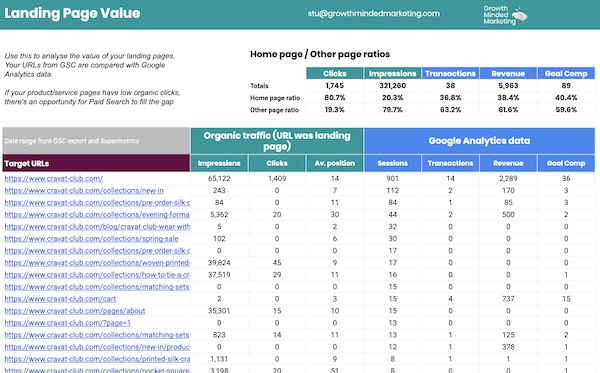
What: The ‘Landing Page Value‘ tab analyses the value of your organic landing pages. Your URLs from the GSC export are compared with Google Analytics data to highlight sessions, transactions, revenue & goal completions for matching URLs.
Why: Analysing the Page Ratio splits, you can see the % of traffic that lands on your home page vs all your other pages, and the value of those with Google Analytics data.
If your product/service pages have low organic clicks/impressions, there’s an opportunity for Paid Search to fill the gap.
Avg position is layered in too to better understand organic positioning – or lack of!
Target Keywords
We’re getting into the juicy stuff with the ‘Target Keywords‘ tab.
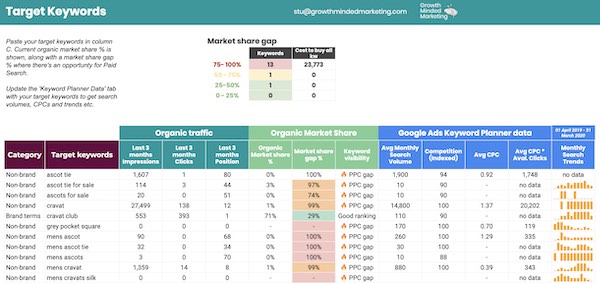
What: You’ll need a target keyword list of terms you want data on. They can be terms you already bid on through paid search, organic keywords you’re trying to rank for – and everything in between!
Why: If you rank organically for your target keyword, you’ll see the usual click/impression data – but also Organic Market Share % data, and more importantly for PPC managers, the Market Share Gap %.
If there’s a 60% or less market share gap for your keyword, you’ll see a ‘🔥PPC gap’ message. Anything below 60% will show ‘Good ranking’
If you’ve exported your target keywords from the Google Ads Keyword Planner, you’ll see search volumes, CPCs & search trends for your term.
Target Keywords – Organic vs Paid

What: With the ‘Target Keywords – Organic vs Paid‘ tab you’ll see a deeper analysis between Organic vs Paid, and the dependency on either channel for your target keywords.
Pulling data from GSC and Google Ads report exports, you can see the data side by side to compare clicks, impressions, CTR etc – but also layering in conversion & revenue data from your Google Ads export.
Measuring the ratio between the 2 data sets, you can see the reliance and dependency between Organic & Paid search for your target terms, as well as current organic position distribution.
Why: The idea is to highlight large gaps in organic performance where paid search can step in a win back market share through the additional available clicks.
It’s also good to check what terms are winning organically. If you suspect some that there’s some keyword cannibalization between paid and organic, you could pull budget from those terms to funnel back into areas where organic visibility is low.
Market Sizing – Google Ads
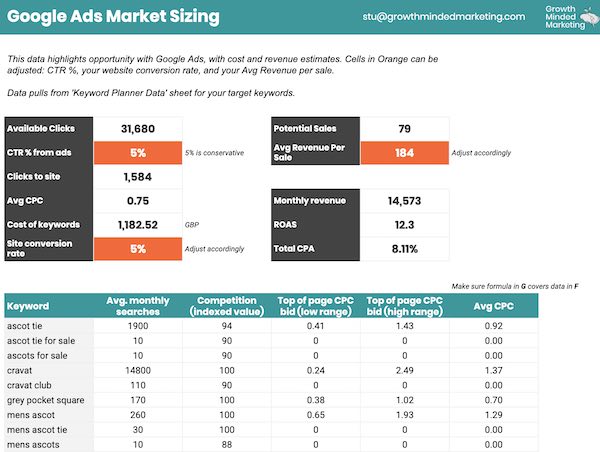
What: The Market Sizing tab data pulls from the Google Keyword Planner data export for your target keywords using a pivot table.
Why: Applying an assumed CTR from ads, your site conversion rate and average revenue per sale – you can see some potential outcomes from the available clicks
Potential sales/leads and revenue based on known CPCs and search volumes from your target seed list can be forecasted.
GSC: New Terms
Pulling from your GSC export, ‘GSC: New Terms‘ shows new terms your site is ranking for organically, compared to the previous date period.
Use this to see new additional keyword opportunities to target through Google Ads that might be highly revenant, but have a low organic ranking position.
GSC: Lost Terms
Same as above, but ‘GSC: Lost Terms‘ shows terms you’ve lost visibility on compared the previous date period.
You might not want to rank for these organically, but there might be some long-tail gems in there to target with paid ads to recover some market share.
Conclusion
So there we have it!
I’ve really enjoyed making this sheet and I hope it’s helpful to businesses, PPC managers and SEOs seeking to better understand the keyword landscape they’re operating in.
While expensive APIs and software subscriptions can do a lot of this analysis and more, it’s been fun figuring out how to get some great insights for free.
We’d massively appreciate a share, a like or mention if you find this helpful 🙂
Please feel free to get in touch if you have any questions about the sheet setup, how best to analyze the data, or how Google Ads can fill the gaps in your organic traffic.